
Why I Should Consider This Offer
- The single largest contributor to carrier cost increases in the past two years comes from increased data usage which will continue to build momentum over the next few years.
- Studies show that average business-liable GB usage per device grew from 1.6 GB in 2015 to 2.4 GB per device in 2017.
- Industry projections indicate mobile data usage will more than triple in the next four years.
What is the Scope of This Analysis
We begin our analysis by uploading the three most recent months of each carrier invoice. Once the data is loaded, MobilSentry™, our data analytics engine, will generate a 10-point automated analysis that will include recommended ways to control employee data usage while quantifying exactly what invoice savings might be expected from increased monitoring and control. Below is a brief description of the 10 points of analysis.
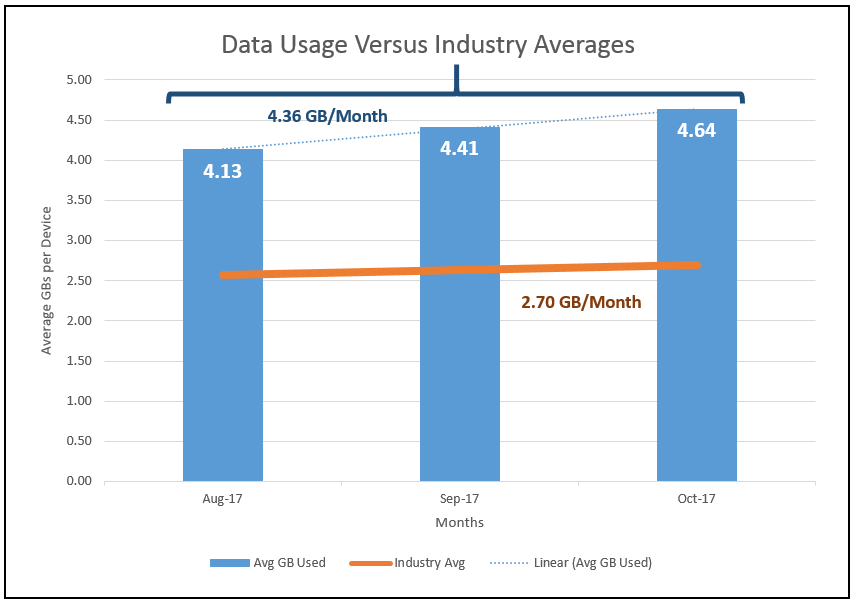
Actual Data Usage Versus Industry Averages – Understanding how your company usage compares to the industry averages is where the assessment begins and sets the context for a deeper look at your company’s data transaction details.
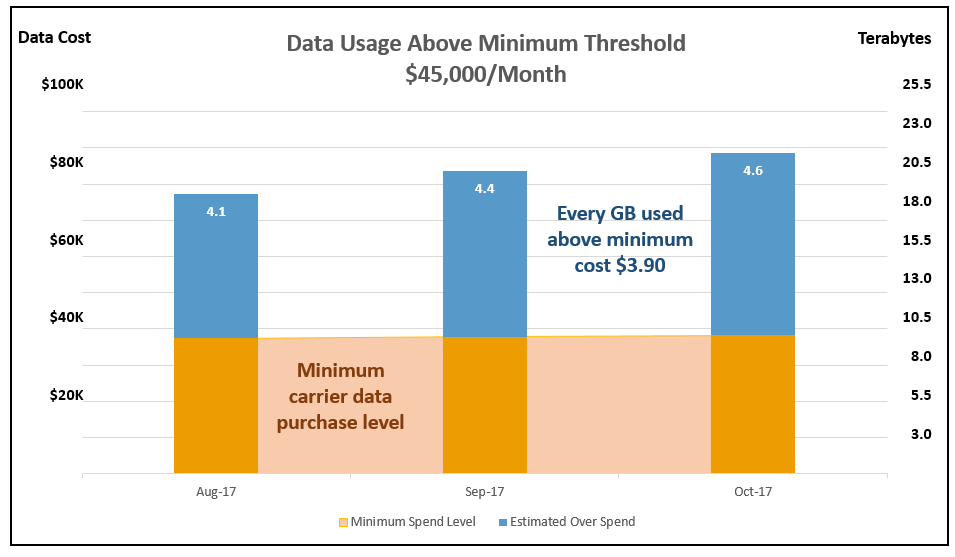
Quantifying Wasted Data Usage – Determining your spend rate over the required carrier minimum data purchase level is the next step. Every client has a unique mix of device types which establishes a minimum data threshold above which there are savings opportunities for every reduced GB of usage.
Reviewing Top Users – Every company has a subset of users who comprise the largest monthly data consumers. Understanding who those users are, and how they are using data is key to gaining control over the problem of increasing wireless costs.
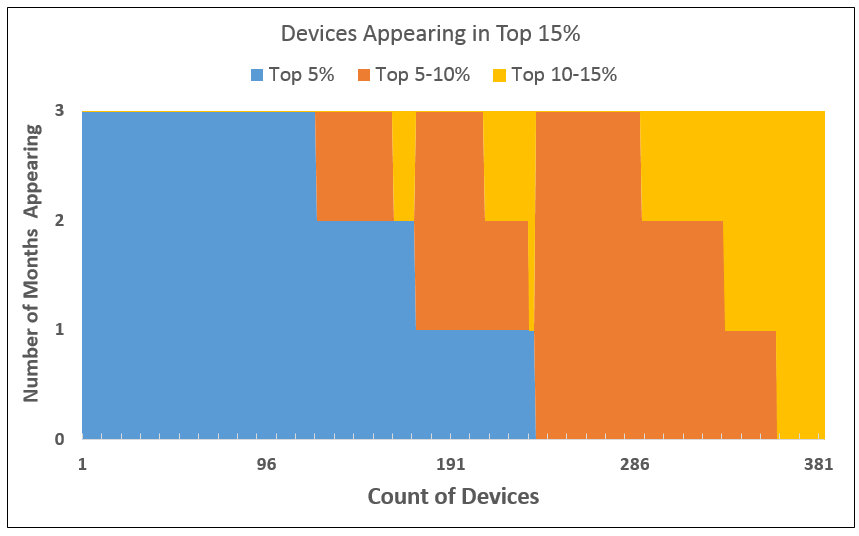
A Look At Repetitive Top Users – Some users may find themselves in the top user percentile occasionally but the real problem lies with those who repeatedly fall in the top percentiles. Knowing who and how frequently they appear is key.
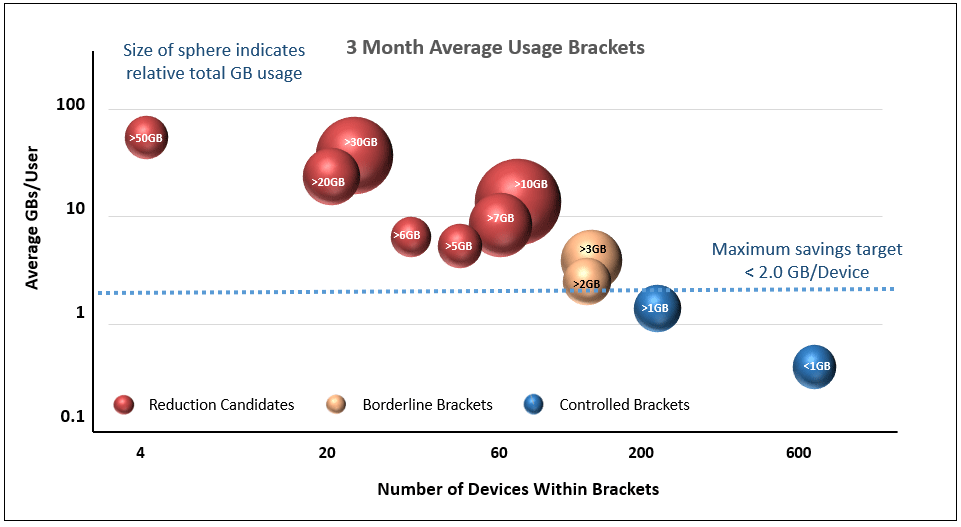
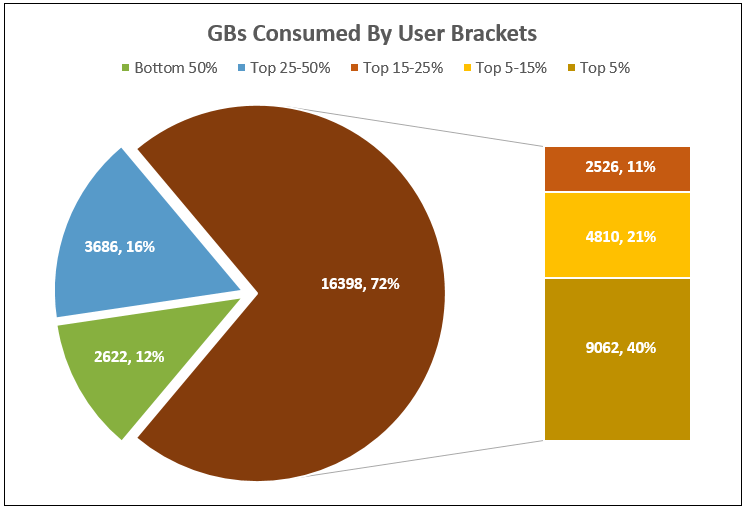
Segmenting Top Users – Once the top users are identified, MobilSentry™ breaks them down further into usage brackets to quantify the problem and to ultimately understand the savings potential related to each bracket.
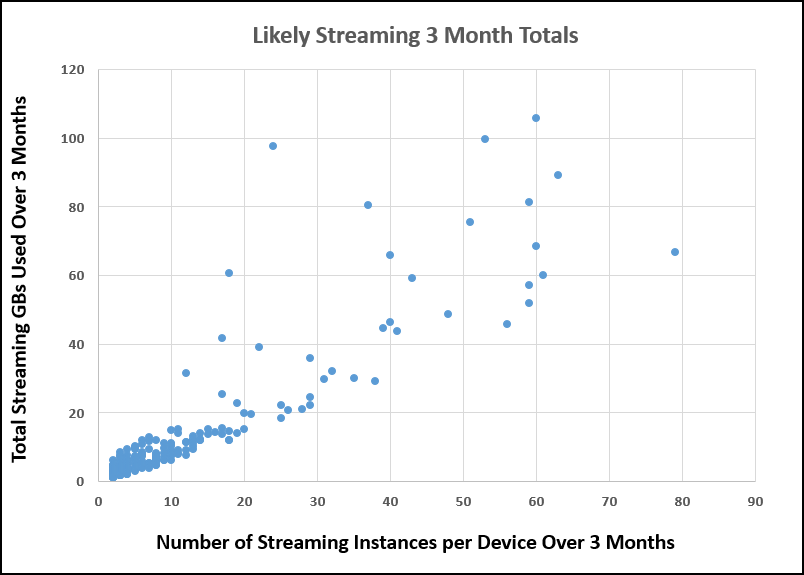
Recognizing Video Streaming – It is well known that streaming video is the most frequent contributor to individual high data usage. One hour of streaming alone can add 1GB of total usage to a mobile device. Knowing who is likely streaming is important to determine appropriate policies and controls.
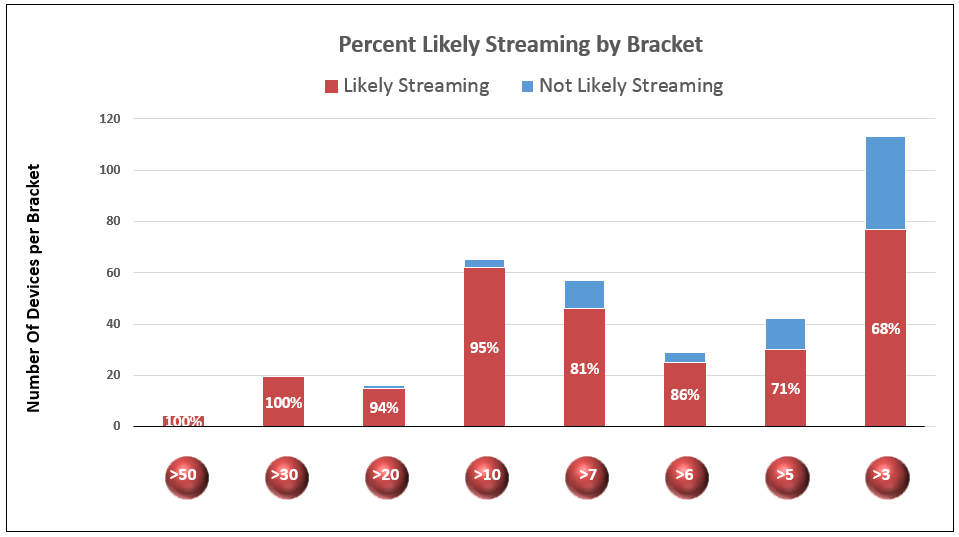
Streaming Users By Bracket – Once likely occurrences of streaming are identified, MobilSentry™ will correlate that information with these top brackets to further recognize the underlying cause of growing data usage.
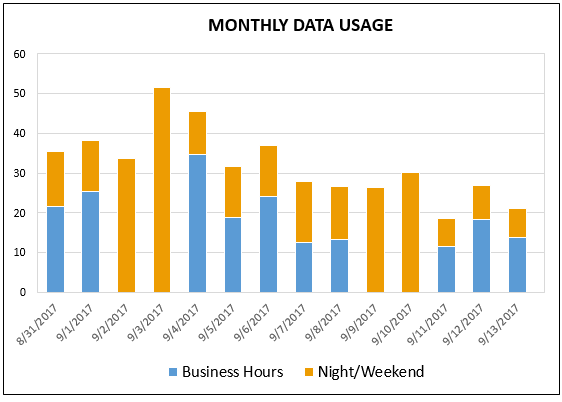
Usage by Time of Day – A revealing look at overall company off-hours/night & weekend versus business usage will identify where the company is unnecessarily paying for an employee’s off-hours entertainment.
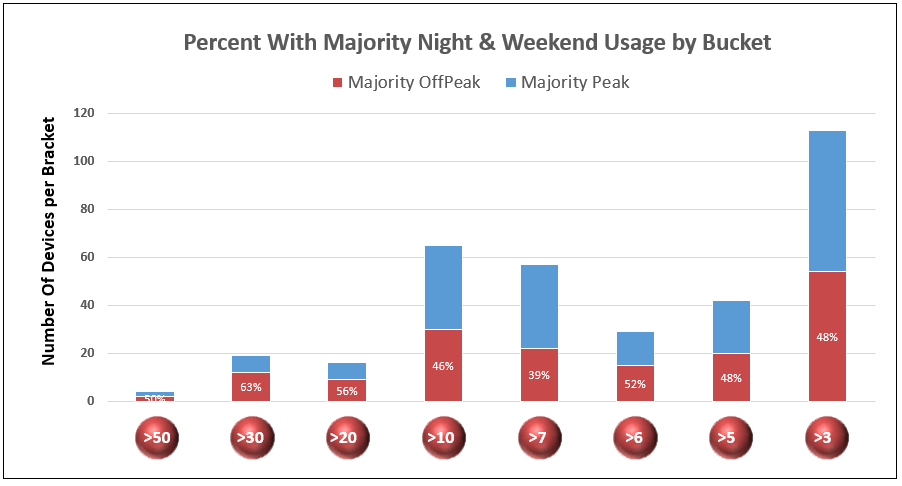
A Look at Off-Hours Usage by Bracket – We can see the potential impact on off-hours usage to the top user brackets by correlating top user brackets with the results of those with more off-hours data consumption than business hours consumption.
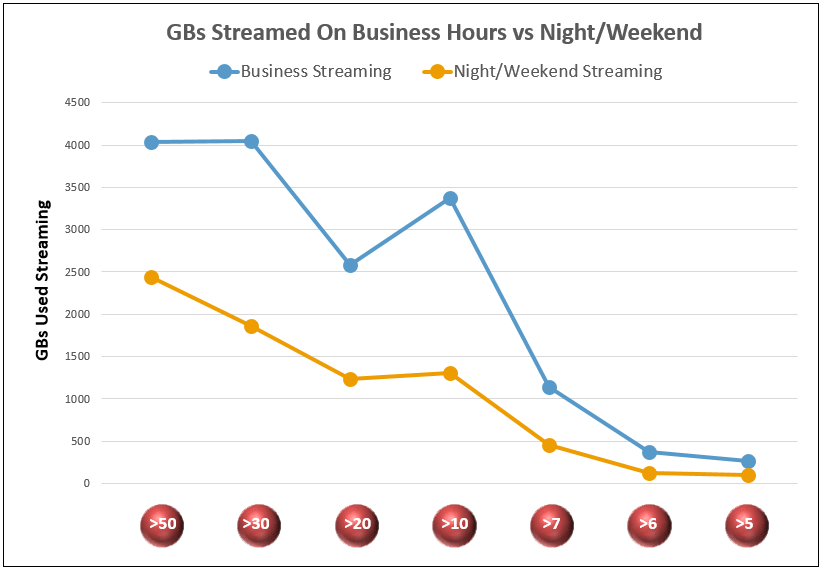
Streaming versus Time of Day – Trends emerge when we correlate streaming with business and off-hours timestamps. Understanding when high data users are streaming by time-of-day can be illuminating.
Actionable Intelligence Leads to Real Cost Savings
Once the 10-point analysis is complete, our experts will provide detailed explanations of all the data analyzed as well as suggest ways to increase control over employee data usage.